
Case study
HR Dashboard
Interactive Power BI dashboard analyzing HR data: employee headcount, salaries, hiring trends, and termination reasons by department, city, and gender.
Data Analytics - Est. 2024
"High-impact Data Analyst and BI Expert with a proven track record of bridging the gap between raw data and executive-level business strategy. Specializing in architecting scalable data pipelines, executing advanced data modeling through Star Schema and Galaxy Schema frameworks, and engineering dynamic, interactive dashboards in Power BI and Tableau. Leveraging a powerful technical stack—including SQL, Python, Advanced Excel, Power Query, and complex DAX—to extract deep operational insights across multi-industry domains including Banking, HR, and Marketing. Armed with elite training from top-tier national initiatives like DEPI and ITI, and driven by a relentless focus on data-driven growth, operational optimization, and turning complex metrics into clear competitive advantages."

2yrs
Building products
3
Featured projects
4×
Roles shipped
9
Tools in kit
The path
Depi
Completed specialized training under the Digital Egypt Pioneers Initiative focusing on core data analysis concepts, data modeling using Star Schema architecture, writing DAX measures, and transforming raw data into actionable insights through robust visualization tools.
ITI
Participated in an intensive training track focusing on Data Engineering and Analysis. Gained hands-on experience in building ETL pipelines, cleaning datasets, writing advanced SQL queries, and utilizing Power BI for creating interactive business intelligence dashboards.
Creativa Benha
Participated in practical data analysis workshops and training sessions at Creativa Benha. Focused on advanced Excel functions, data cleaning using Power Query, structuring relational data, and designing interactive Power BI dashboards to solve real-world business scenarios.
QNB Bank
Assisted in analyzing financial datasets to support banking operations and reporting. Utilized Microsoft Excel for data cleaning, sorting, and pivoting to ensure data integrity. Collaborated with the team to visualize trends and present findings to senior staff.
Banha University
Relevant coursework: Database Management, Statistics, Systems Analysis, Programming. GPA: 3.11/4.0
CREATIVA BENHA (Creativa Benha / ITIDA)
IBM SkillsBuild
Toolbox
3 collaborations. Each one shipped and still running.
Interactive Power BI dashboard analyzing HR data: employee headcount, salaries, hiring trends, and termination reasons by department, city, and gender.
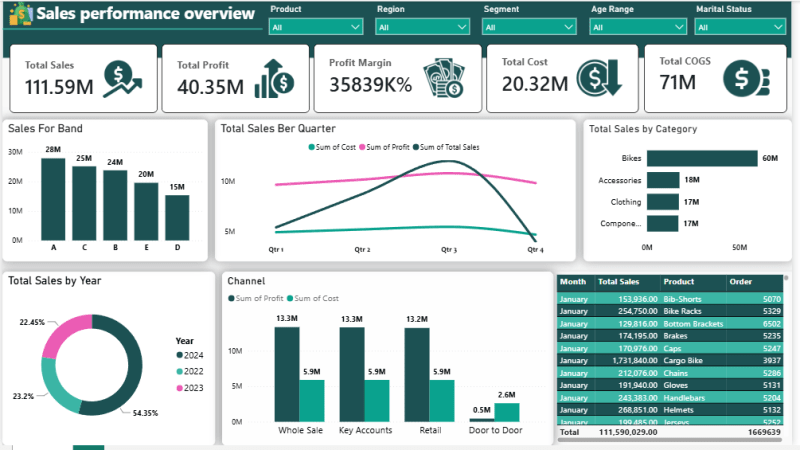
power-bi dashboard data-visualization sales-analysis business-intelligence dax
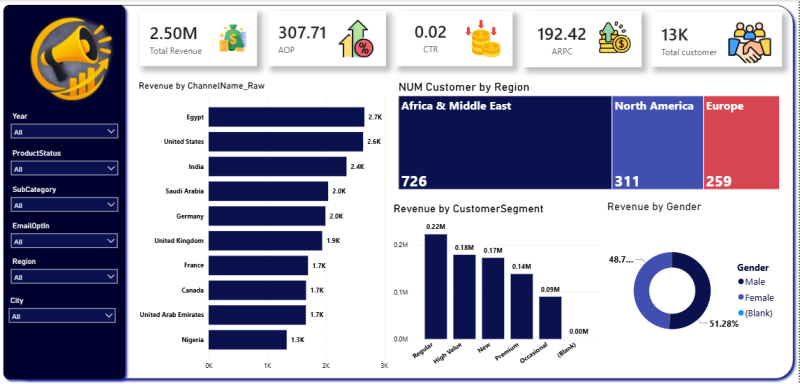
Power BI dashboard analyzing marketing performance: revenue, ROI, ROAS, CAC, campaigns, customers, and channels.
Currently
Working as Data analysis at Depi.
Available
Taking on projects for Booking Q4 2026.
Next chapter
Booking Q4 2026. Tell me what you're building, I reply within a day.
magdyahmed7110@gmail.com